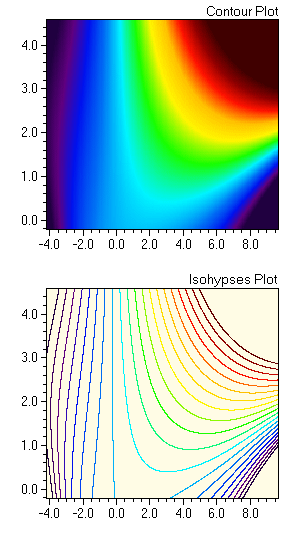
A contour plot is a graphical technique for visualizing 3-dimensional surfaces by plotting lines (isohypses) at constant altitudes (z coordinate) on the base plane (x-y-plane). As an alternative the lines may be replaced by a colored base plane, whose colors represent the z-values.
The class TContourPlot supports the generation of both isohypses (colored or monochrome, see bottom left) and color encoded base planes (top left). You can freely configure all parameters of the plot, such as the range of the axes, the color array, the mapping of the colors to the z-values, the distance of the isohypses, etc.
For more details please have a look at the online help pages and the example program below.
The component TContourPlot is part of the unit RCHART which is part of the SDL Component Suite.
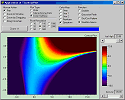
| Contour Plot |  This application shows the usage of the component TContourPlot to visualize complex surfaces either by using isohypses or by displaying color encoded base planes. The user may select from different functions and can experiment with various parameters of the component. This application shows the usage of the component TContourPlot to visualize complex surfaces either by using isohypses or by displaying color encoded base planes. The user may select from different functions and can experiment with various parameters of the component. |
contplot.zip
(326 kB) |
What's new:
- Release 12.1 [Sep-30, 2025]
- no changes
- Release 12.0 [Dec-12, 2023]
- no changes
- Release 10.6 [Mar-09, 2018]
- the TContourPlot class provides now the following methods and properties to draw on top of the contour plot: DataContainer, NumItems, DataColor, FillColor, LineWidth, TransparentItems, Arc, Bar3D, Ellipse, Arrow, Text, DrawTo, DrawToRelPix, Line, LineOffset, ClassDefault, MoveTo, MoveToRelPix, MarkAt, MarkErrorBar, Rectangle, RectangleRelPix, RectFrame, SaveData, LoadData, PenStyle, TextFontStyle, TextBkStyle, TextBkColor, ClassVisible, Isometric, Font
- TContourPlot.TextBkColor is deprecated and has been replaced by FillColor
- the propertyTContourPlot.TextFont provides a global definition of the font of the text elements
- TContourPlot now supports long text elements DataLongText
- TContourPlot now support annotations, providing the following properties and methods: CountAnnoByClass, CopyAnnoFrom, LoadAnno, SaveAnno, NumAnnos, AnnoClassVisible, FindNearestAnnoElem, AnnoContainer, AnnoMode, ClearAnnotations, RemoveAnnoItem, AnnoBelowChart, AnnoLongText, AnnoTextOnTop, SearchAnnoItem, AnnosVisible
- the method TContourPlot.GetTransformParams retrieve the scaling parameters of the axes
- the TContourPlot class now provides the following properties to control the caption of the chart: CaptionPosX, CaptionPosY, CaptionAlignment, CaptionAnchorVert, CaptionAnchorHoriz
- the new method TContourPlot.ConfineZoomRange allows to confine zoom and pan actions in contour plots
- the new methods TContourPlot.SearchDataItem allow to search for data items
- the new properties TContourPlot.PanGridOffsX and TContourPlot.PanGridOffsY allow to shift the snap positions when MouseAction is set to maPanGrid.
- TContourPLot now provides three additional drawing elements: TContourPlot.CursorVert, TContourPlot.CursorHoriz and TContourPlot.DoubleArrow
- the property TContourPlot.PlotMode has been extended to support transparent pixel images
- TContourPlot.PercentilePivots supports now the restriction of the percentile calculation to unmasked areas
- the events TContourPlot.OnBeforeRenderData, TContourPlot.OnScalesRendered and TContourPlot.OnScaleTickDrawn are now published properties
- the properties TContourPlot.ScaleX and TContourPlot.ScaleY provide now the sub-property MouseAction which allows to control the interactive panning and zooming of the scales
- the new method TContourPlot.DetectScale allow to check the presence of a scale at a particular position of the chart canvas
- bug fix: TContourPlot.Assign did not copy the mask palette
- Release 10.5 [Oct-10, 2016]
- the new property TContourPlot.InvalidDataBmp indicates changes in the contour plot data area
- a mask value of 255 has now a special meaning (color inversion of the underlying image)
- TContourPlot now supports recording the mouse trace: MouseTrace, ClearMouseTrace, NumMTracePoints, MouseTraceColor, MouseTraceInvert
- Release 10.4 [Jun-02, 2015]
- the array PivotMat provides access to the values of the pivot matrix
- the method CalculatePivotPoints now supports pre-calculation
- the new method ClearPivotPoints clear the pivot points
- the new method CrossHairSetPos allows to set the position of the crosshair
- Release 10.3 [Oct-06, 2014]
- speed of the TContourPlot drawing now increased by a factor of 100
- the new array property Mask allows to set fixed "masked" areas in a contour plot
- the array property MaskPalette controls the colors of the pivotal mask
- PercentilePivots calculates a percentile of the z values of the pivot points
- CalculatePivotPoints recalculates the pivot points
- the new events OnSelectRect, and OnRubberBand are triggered after the selection of a rectangular region and after drawing a rubber band, respectively
- Release 10.2 [May-30, 2013]
- TContourPlot supports now the Assign method
- the new methods CopyToClipboardDAOnly and CopyToBitmapDAOnly copy the data area only (not including the scale region)
- bug fix: IsoColQuad created a range error if the data were far outside range of the isohypses
- Release 10.1 [Oct-29, 2012]
- no changes
- Release 10.0 [Oct-4, 2011]
- no changes
- Release 9.7 [May-31, 2010]
- no changes
- Release 9.51 [Dec-01, 2008]
- no changes
- Release 9.5 [Oct-31, 2008]
- first release to the public


