| The SDL Component Suite is an industry leading collection of components supporting scientific and engineering computing. Please visit the SDL Web site for more information.... |
|
Home  ChartPack RChart Class TContourPlot Properties Mask ChartPack RChart Class TContourPlot Properties Mask |
|||||||||
| See also: NumPivotsY, NumPivotsX, CalculatePivotPoints, MaskPalette, FillMask |   |
||||||||
Mask |
 |
||||||||
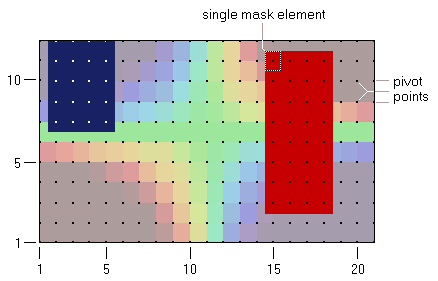
The contour plot component has a built-in mechanism to mask parts of the plot. The mask is coupled to the pivot points; each mask element is a rectangular area around a pivot point, whose size is equal to the distance of the pivot points. The Mask may either be controlled by the array property Mask or, alternatively, during the redraw of the contour plot by adjusting the Mask parameter in the OnEstimateZVal event. The Mask array is in fact an array of byte values and has always the size NumPivotsX by NumPivotsY. The value of a particular mask array cell controls the visibility of the area around the corresponding pivot point. A value of zero indicates a transparent mask cell, a value of one suppresses the drawing of both the data and the mask (resulting in an empty area colored by the propert ChartColor), all other values result in non-transparent cells whose colors are determined by the corresponding mask value (which is treated as an index into the MaskPalette color array). The following figure shows two masked areas. The position of the pivot points are indicated by small dots. The property NumPivotsX has been set to 21, the property NumPivotsY has been set to 12. The cells from [2,7] to [5,12] are covered by a blue mask, the cells from [15,3] to [18,11] are covered by a red mask.
|
|||||||||
Last Update: 2023-Dec-13