| PlotMode |
Description |
| cpmDots |
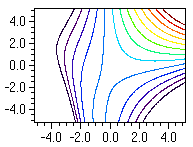 Isohypses consisting of colored dots (simulating a contour line); the colors are taken from the property IsoColors. The properties IsoLow, IsoHigh, and IsoDist control the first and the last line, and the distance between lines, respectively. Isohypses consisting of colored dots (simulating a contour line); the colors are taken from the property IsoColors. The properties IsoLow, IsoHigh, and IsoDist control the first and the last line, and the distance between lines, respectively.
|
| cpmMonoDots |
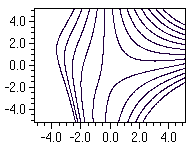 Isohypses consisting of black dots. The properties IsoLow, IsoHigh, and IsoDist control the first and the last line, and the distance between lines, respectively. Isohypses consisting of black dots. The properties IsoLow, IsoHigh, and IsoDist control the first and the last line, and the distance between lines, respectively.
|
| cpmColorSurface |
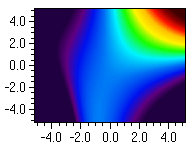 Colored surface plot; the colors are taken from the property IsoColors. The color scale is determines by the properties IsoLow and IsoHigh. Colored surface plot; the colors are taken from the property IsoColors. The color scale is determines by the properties IsoLow and IsoHigh.
|
| cpmColorSurfNoIp |
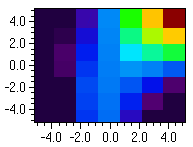 Colored surface plot without interpolation; this mode is basically thought to support "pixel" images in order to be able to display raw data at their original resolution. The colors are taken from the property IsoColors. The color scale is determines by the properties IsoLow and IsoHigh. Colored surface plot without interpolation; this mode is basically thought to support "pixel" images in order to be able to display raw data at their original resolution. The colors are taken from the property IsoColors. The color scale is determines by the properties IsoLow and IsoHigh.
|
| cpmColorSurfNoIpTransp |
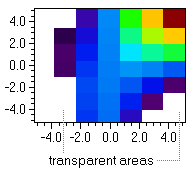 Colored pixel plot; areas having values outside the range of the color scale are transparent. This mode is basically thought to support pixel images on top of a general background (which can be a photo, for example). The colors are taken from the property IsoColors. The color scale is determines by the properties IsoLow and IsoHigh. Colored pixel plot; areas having values outside the range of the color scale are transparent. This mode is basically thought to support pixel images on top of a general background (which can be a photo, for example). The colors are taken from the property IsoColors. The color scale is determines by the properties IsoLow and IsoHigh.
|

 ChartPack
