| The SDL Component Suite is an industry leading collection of components supporting scientific and engineering computing. Please visit the SDL Web site for more information.... |

|
Home  ChartPack RChart Class TContourPlot Properties PivotResolution ChartPack RChart Class TContourPlot Properties PivotResolution |
|||||||||||||
| See also: NumPivotsX, NumPivotsY |   |
||||||||||||
PivotResolution |
 |
||||||||||||
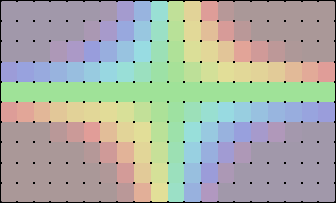
The PivotResolution controls the resolution of the rectangular grid which is used to construct the contour plot. The PivotResolution may take values between 10 and 5000 and specifes the number of pivot sections times 5 along the longer axis of the plot. The number of pivot points along the shorter axis is adjusted in proportion. The following figure shows the pivot points on top of a colored contour surface. The PivotResolution has been set to 100. Thus the x-axis (the longer axis) is divided into 20 sections (21 pivot points), the y-axis is divided into a number of sections which results in approximately quadratic pivot elements.
|
|||||||||||||
Last Update: 2023-Dec-13