RCHART - Display of time series
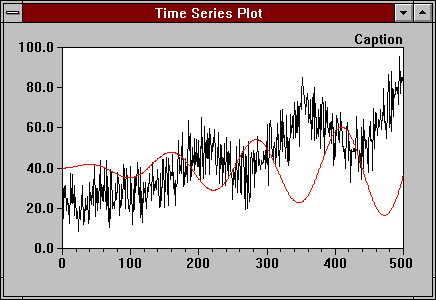
The chart below has been created by the following code (the extents of the chart window and the range of the real coordinate system have been set during design time):
RChart1.MoveTo (0,0);
for i:=1 to 500 do
  RChart1.DrawTo (i,i/10+i/30*sin(i*0.04)+20*(random+random));
RChart1.DataColor := clRed;
RChart1.MoveTo (0,40);
for i:=1 to 500 do
  RChart1.DrawTo (i,40+i/20*sin(i*0.05));


